
THO

Hello!
The is the second stock I’m valuing here on my substack. If you missed the first one, I valued SWBI the other day. As always, my goal is to clarify my thinking, document my valuation, and open my thesis up to constructive criticism. If you disagree about anything in my analysis, please let me know so I can see some other perspectives!
THO
Today I want to value Thor Industries (THO). Currently at $82.64 a share.
Thor is a major player in the RV market (something like ~40+% of the North American RV market in 2020). Most of its sales come from North America, but a decent number of sales are from Europe particularly Germany.

The consumer cyclical nature of the business, and its European exposure, worries me a bit given the looming interest-rates hikes and the impact the Russia-Ukraine war on Europe’s economy. But we’ll address all those issues later when we estimate growth.
The first thing I like to look at is the outstanding shares and how that’s changed. Outstanding shares have increased ~5.7% in the last few years. That’s a bit of a red flag to me.

A quick look at some of the ratios shows it’s worth further investigation.
PE: 6.21
P/FCF: 9.70
ROE: 27.8%
ROIC: 28.00%
Current Ratio: 1.58
The stock is down ~41% percent from its high in April 2021.

This drop is interesting because earnings have been strong lately. Thor has consistently beat expectations and guidance has been solid.

Analysts seem to like the stock as well - so why has the market turned on it?

My suspicion is that the reason for the steep decline is because the RV market is quite sensitive to recessions.
...as one dealership owner explained, “You need food, you need clothes, but you don’t need an RV,”
Back before the pandemic The Wall Street Journal noted, in an article that highlighted Thor specifically, that RV sales are a leading indicator of recessions.
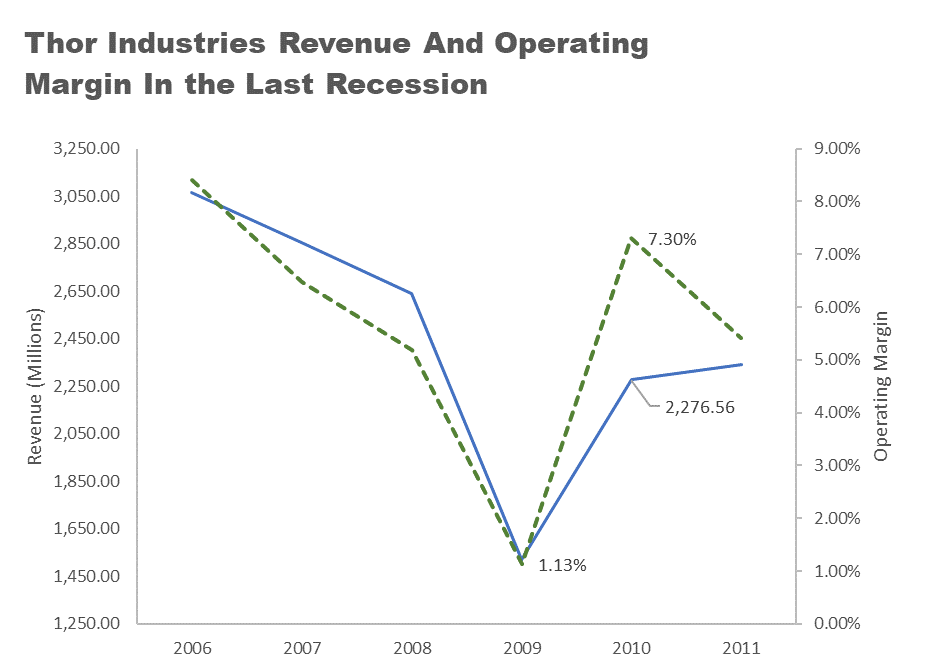
We can see that the last recession in 2008 hit the RV market pretty hard.

My guess is that Thor is down ~41% off its high because market is concerned about the risk of a recession. The earnings are still good, the analysts are still optimistic, but with the yield curve flattening, oil spiking, and interest rates going up, the forward-looking market is factoring recession risk into Thor’s price. All that being said - we can still value this recession sensitive stock if we’re careful and conservative.
Valuation
We’ll value the company with a DCF based on Aswath Damodaran’s DCF model using Tracktak.com (a fantastic resource). I’ll include a link to download my DCF at the end, but first let’s go through the assumptions:
Risks
A good place to start is to look at the risks in the 10K - you can find the latest 10k for THO here.
Looking through the 10K, the two big risks that jumped out to me were the exposure to the European market and the supply chain risks. Especially the supply chain risk to semiconductors. I’ve seen almost no improvement in existing supply chains, and the war in Ukraine could add to the chip shortage.
I think we can account for the probability of a European recession, but the supply chain problems are tricky. I’m going to add a 2% probability of failure over the next decade in case some dramatic semiconductor shortage eliminates their ability to produce vehicles. Though I note that so far, they have done quite well despite the existing chip shortage issues.
Revenue - Adjustment
I’m not trying to time the market, but with a recession sensitive stock like this, to be conservative, I think we should assume that we see a recession in the next decade. The most conservative approach is to assume that we hit a recession next year that matches the lows of the 2008 cycle. Looking at Thor specifically, we can see revenues fell ~42% in the last recession.

So, let’s do that. For the base year, we’ll keep revenues as they are, but we’ll drop revenues by 42% to $8,105.56 (millions) for year 1.
Growth - CGAR
The tricky part of a DCF is usually the growth rate. I like to look at it from a few ways a get a conservative estimate.
Looking at the graph of revenues, I think a fair range would be from 2011 to 2016. We’ve already factored in a steep recession, and this range excludes the big 2020 jump.

Using the compound annual growth rate formula between these years we calculate a growth rate of 11.85%. I also considered looking from 2011 to 2020 which would give us a rate of 13.31%.
There are other ways of estimating growth besides looking at the historical data. Aswath Damodaran covers some of them here. I like the estimate that is based on the reinvestment rate of a company and its return on investment. That methodology gives us an estimate of 24.80%.
Looking at estimates for the Recreational Vehicle industry, estimates seem to range from 10%; 11.38% in Europe; 5% in North America; and 6.7%.

I’m going to go with a 10% growth rate which I think is reasonable and quite conservative when you consider we’ve already accounting for a deep recession in our model. After accounting for a recession in year 1, a 10% growth rate over the rest of the decade works out to only about 1% CGAR for the decade.
Operating Margin
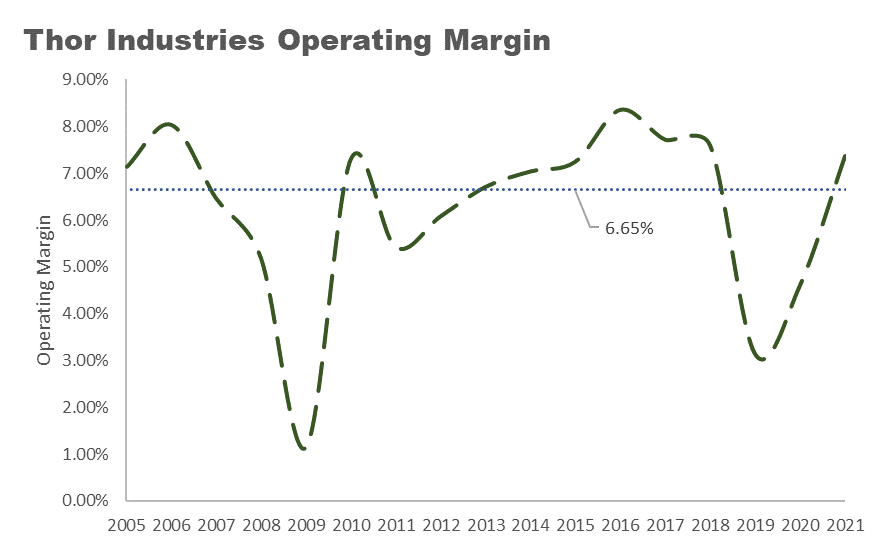
Thor’s operating margin is currently ~7.37%. But, like revenues, this can fall sharply in a recession. In the last recession margins fell to 1.13% - so just like we adjusted revenue down for a hypothetical recession, we’ll do the same for margins and drop the operating margin to 1.13% for year 1.
When not in a recession, the margins are otherwise fairly consistent. If you exclude 2009, the average margin is 6.65%.
However, there was a line in the 10K which noted that:
Recently, a number of other U.S.-based independent dealers have acquired, and continue to acquire, formerly independent RV dealerships, resulting in further independent dealer concentration. Continued consolidation in the U.S. independent dealer network could negatively impact our sales or gross margins and increase the concentration of our exposure under repurchase obligations related to independent dealers
Because of this concern, to be conservative, I’m going to drop the average operating margin by seven percent to an average 6.18% Operating Margin for the decade (excluding our hypothetical recession where it drops to 1.13%).
Sales to Capital Ratio
This is a bit of a harder call. Currently its TTM sales/capital ratio is 2.73, but that is much lower than the average.

We should understand what this ratio represents though. It’s a measurement of the efficiency of capital. It has dropped considerably from 2019 because of the debt taken on for the acquisition of Erwin Hymer Group (A large European RV manufacturer).
Should a recession indeed happen in year 1, and revenues fall as we have projected, this ratio is likely to further drop to ~2. and then slowly rise back to the 3.1 range. Therefore, we will model year 1 as 2; year 2 as 2.42; year 3 as 2.9; and then 3.1 for the rest of the decade.
DCF
With these assumptions we can now run a DCF to get a valuation for THO.
I’ve uploaded my DCF to github so you can see the calculations for yourself. With these assumptions we arrive at a Valuation of $94.53 meaning that THO is currently ~12.57% Undervalued.
But let’s not get too excited yet, below you can see a sensitivity analysis showing what the valuation would be with different values for the growth rate (CAGR) and the Operating Margin. This stock is actually quite sensitive to our growth and margin estimates. Especially the operating margin estimate.

And let’s not forget that worrying increase in outstanding shares. For this company, I think we need an additional measure of safety.
Monte Carlo Simulation
To get a better margin of safety with the company, we can run a simulation of all of these interconnected variables of operating margin, growth rate, sales to capital ratio -and how they interact with each other in a monte carlo simulation.
Our Inputs:
The CAGR Standard Deviation 3.00%
Operating Margin Min/Max between 5.50% and 8.00%
Sales to Capital Ratio Min/Max between 2.00 and 3.00
That spits out these percentiles of forecasted values.
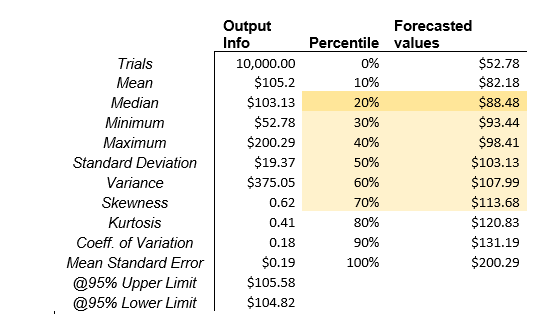
Don’t let the fancy math fool you - as with all things its Garbage in. Garbage Out. This is just saying if we let all of the variables change between set inputs according to a probability distribution, this is what it looks like. If everything goes your way maybe, it’s worth $200. If everything goes against you, maybe $53. But of course, these aren’t independent variables. Revenue may well drop with margins and pull down the sales/capital ratio.
All that said, I think this does give us some insight into what valuation would be likely if all of our inputs come in on the low-end of the range. I’m going to go with the 20th percentile at $88.48 so that I have some margin of safety. Given that, I think the stock is essentially 6.6% Undervalued.
Strategy
So, what might good strategy for this stock be? Our conservative analysis says it’s slightly undervalued, so we are interested at this price point. We could buy and hold, or since it’s trending down, I think a good way to enter the position is by selling puts.
Looking at the options market - $75 Puts are selling for $6.55 for June 17th with a breakeven price of $68.45. What this means is that someone will pay me $650 for a promise they’ll have the option to sell me 100 shares of THO on June 17th for $75 a share. If the stock crashes to $50 a share, I’ll still have to pay $75 for them, when you include the $650 they paid me my breakeven would $68.50 a share. So, if it falls below that point, I will have lost out. However, 68.50 is ~22.5% below my valuation, and I would be happy to buy it at that price.
And if the stock stays above $75, I’ve made $650 while tying up $7,500 of capital for 102 days. That’s an annualized return of ~31% So, selling puts seems like a good option at this point.
However, given the trend and current macroeconomic outlook, I suspect the stock might continue to fall for some time. The best strategy might be to simply watch the stock and slowly build a position as it continues to fall.
Remember, the great thing about value investing is that you don’t need to take greater risks for greater rewards. to quote Warren Buffet:
The exact opposite is true with value investing. If you buy a dollar bill for 60 cents, it’s riskier than if you buy a dollar bill for 40 cents, but the expectation of reward is greater in the latter case. The greater the potential for reward in the value portfolio, the less risk there is.
One last thought - if you do like the company, keep a close eye on the operating margins in the future and see if the investment thesis needs to be updated.
I would love to hear your opinion of the analysis! Poke holes in it - what did I get wrong?? And please subscribe for future valuations :)
All content is for discussion, entertainment, and illustrative purposes only and should not be construed as professional financial advice, solicitation, or recommendation to buy or sell any securities, notwithstanding anything stated.
There are risks associated with investing in securities. Loss of principal is possible. Some high-risk investments may use leverage, which could accentuate losses. Foreign investing involves special risks, including a greater volatility and political, economic and currency risks and differences in accounting methods. Past performance is not a predictor of future investment performance.
Should you need such advice, consult a licensed financial advisor, legal advisor, or tax advisor.
All views expressed are personal opinion and are subject to change without responsibility to update views. No guarantee is given regarding the accuracy of information on this post.
Can you share how you go about your valuation?
What books/education did you take to do this?